Vapor Pressure of a Pure Volatile Liquid
Lehigh University, William J Leon
January 17, 2022
Welcome to the web publication of the Physical Chemistry Lab’s Heat of Vaporization experiment. Below, you will find the lab manual in its entirety compiled with LaTeXand converted to HTML and CSS with make4ht. This abstract serves as quick overview for student, instructor, and TAs to orient themselves on what to expect from the lab document. The experiment has students boil different liquids at controlled pressures. The data, in the form of boiling temperature at a given pressure, is then used to determine thermodynamic properties of enthalpy and entropy of vaporization with the help of the Clausius-Clapeyron equation.
BACKGROUND
Most of the theory is covered in Book on Chemisty during courses Chemistry Course, Chem Engineering Course, and maybe Physics Course In the study of thermodynamics you have learnt or will be soon learning about the factors that determine when a pure liquid substance is in equilibrium with its vapor phase. Experimentally, for equilibrium to exist within a liquid-vapor system, it must be closed, that is the vapor is not disappearing into the ambient as it would if you had an open beaker of the liquid. Note that, in theory, we can choose an imaginary boundary encircling a smaller open system (where liquid and vapor exchange is allowed) within this bigger closed system.
At equilibrium the rate of vaporization of the liquid equals the rate of condensation of the vapor. One might imagine intuitively that these rates would be dependent upon the temperature of the system. Furthermore, the rate of condensation would also depend upon the concentration of the vapor, while the rate of evaporation should stay constant, because the density of a liquid remains constant at fixed temperature. From the ideal gas equation
at a specific temperature , the gas concentration is proportional to its pressure . Thus, it makes sense that at a given temperature there is a specific value for the liquid’s vapor pressure at equilibrium. We will explore this from a more quantitative, thermodynamic approach.
The condition at equilibrium is that the molar Gibbs free energy, or chemical potential of a pure liquid is equal to that of the gas, . Recall that the differential for chemical potential is given by
where and are the molar volume and molar entropy, respectively, of the pure substances. As the chemical potential of the liquid and vapor are equal at equilibrium, so are the differentials for the chemical potential. Thus,
As we are interested in how vapor pressure changes with temperature, we solve for :
where and are the changes of molar entropy and molar volume associated with vaporization of our pure liquid. Again, recall that at equilibrium the chemical potential (i.e. molar free energy) of liquid and vapor are equal or, equivalently, the change of molar Gibbs free energy, , for liquid-vapor transition is zero. From the definition of Gibbs free energy we have
Substituting into Equation (4), we have
Equations (4) and (6) are forms of the Clapeyron Equation.
Now to substitute for we note that the molar volume of the vapor is much greater than that of the liquid, so we can safely approximate the change of molar volume by just the molar volume of the gas. We further approximate the Clapeyron Equation by replacing molar volume via the ideal gas law using Equation (1) and obtain
or, after rearranging,
Equation (8) is known as the Clausius-Clapeyron Equation.
By integrating this expression from some standard pressure (where equilibrium is reached at boiling temperature ) to actual pressure and temperature and assuming that is independent of temperature over the range of vapor pressure measurements (i.e. ), we have
Observing that according to Equation (5), () and setting , we finally have:
The point of this derivation comes down to Equation (10). If one can measure the vapor pressure over a liquid as a function of temperature and one assumes that this vapor follows the ideal gas law fairly closely, then by plotting the natural log of pressure versus , one should get a straight line. The slope of this line will yield a value for the standard molar enthalpy of vaporization, while its intercept yields the standard molar entropy of vaporization.
There are at least two possibly significant approximations made in this derivation. Gasses tend to deviate from ideal behavior near their critical temperature. A measure of this non-ideality is the gas compressibility factor, ,
Using this expression to substitute for in the Clapeyron, Equation (6), Equation (9) becomes
and the slope of this plot versus , if linear, is . The second assumption to get a linear result from Equation (10) 10 or (12) was that is fairly independent of temperature. In fact, this assumption also breaks down near critical temperature (where tends to zero) and, generally, decreases slightly with increasing at temperatures far from the critical point. Recall that the unique critical temperature and pressure for a specific pure substance indicate the temperature and pressure beyond which the liquid and vapor phases are no longer distinguishable. Both and the compressibility factor decrease with and, as a result, the ratio stays fairly constant.
In this experiment, we will be using a dynamic method to measure the vapor pressure of a pure liquid as a function of pressure. Recall that at the temperature at which a liquid begins to boil, the vapor pressure of that liquid is equal to the external pressure. In our apparatus, we will be controlling the pressure above our liquid sample by using lab air and a vacuum system. Maintaining the pressure to a near constant value while our sample liquid boils will be done by having a relatively large ballast volume as part of our system. Pressure will be measured by an electronic pressure gauge. The boiling liquid will be refluxed.
SAFETY
- Safety goggles must be worn.
- Be careful in dealing with organic liquids. If any gets on your skin, wash it off immediately.
- Be careful with the vacuum system. Ask the instructor for help the first time you use it. In particular, make sure that the system’s cold-trap located near the vacuum line inlet has liquid nitrogen in the Dewar to prevent condensable vapors from entering the pump.
- IMPORTANT: the liquid nitrogen cold trap must always be actively evacuated.this whole wording needs to be changed in accordance with the actual valv manipulation being used below To ramp up the pressure in the course of your experiment, the vacuum line must be shut off from your setup. Turning the valve either between the trap and the vacuum line or between the trap and the rest of your setup will allow you to carry on with collection of the data, but having the cold trap exposed to your apparatus will result in condensation of significant amount of test liquid in the trap. Long term exposure to high pressure of oxygen (from air) could also result in condensation of liquid oxygen. Organics are explosive on contact with liquid oxygen.
- The ballast bulb must be taped. In the very rare event that the bulb were to implode, the tape would greatly limit the likelihood of glass pieces flying off.
- If you smell any organic fumes while doing this experiment, get the attention of the instructor.
PROCEDURE
Apparatus
- 1.
- A close but inexact representation of the apparatus you will
be constructing is depicted below in Figure 1. Parts include a
5 L ballast bulb, pressure gauge, heavy-walled rubber tubing,
distillation flask, thermocouple, reflux condenser, water tubing,
electrical heating mantle, and lab stand clamps. This experiment is
to be performed within a chemical hood.
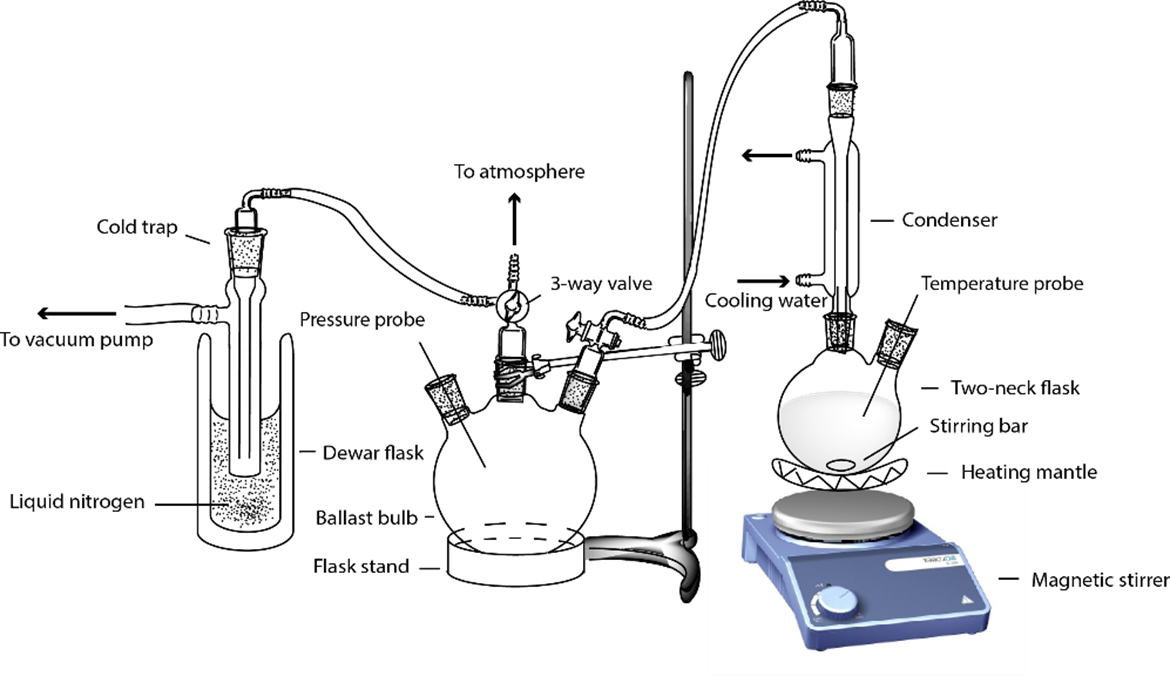 Figure 1: Experimental setup for determination of the heat of
vaporization.
Figure 1: Experimental setup for determination of the heat of
vaporization.
- 2.
- Assemble the apparatus using cleaned glassware. Grease the joints (ask the teaching assistant for demonstration of a proper technique). Your apparatus is to be connected to the central vacuum line (the fixture within the hood) via a cold trap. Upon completion of assembly, open the apparatus to the vacuum line and pump the system to about 100 torr. Close the vacuum line and observe how well the pressure is maintained within the apparatus. If the pressure increases more than 10 , seek and repair leaks within the system and test again.
- 3.
- You will be given two liquids to study. They will have a normal boiling point less than or not significantly greater than that of water (e.g., water itself, n-heptane, cyclohexane, or 2-butanone.)
- 4.
- Fill the distillation flask about 1/3 with the liquid to be studied. Add a few boiling chips to the liquid to reduce potential “bumping” during the experiment or use a magnetic stirrer.
- 5.
- Place the thermocouple through the septum of the flask containing your test liquid and set it a few millimeters above the liquid surface. Turn on the water for the condenser. (It should always be on before turning on the heating mantle.)
- 6.
- Measure and record the room’s ambient pressure and temperature using your setup and compare them with readings from a commercial standalone temperature and pressure gauge.
- 7.
- Ask the teaching assistant to fill the Dewar with liquid nitrogen and receive instructions on the safe use of liquid nitrogen trap.
Boiling Point Measurements
- 1.
- Evacuate the manifold using the vacuum system to a pressure of about 100 Torr. Then close the three-way valve to the cold trap.
- 2.
- Raise the temperature within the apparatus until there is a steady stream of bubbles coming from the liquid. Avoid heating the liquid too quickly.
- 3.
- Determine the temperature of the equilibrated vapor and condensate to the nearest 0.1 C. Also measure the pressure to the nearest 0.1 Torr.what is your actual error given your measuring instrument?
- 4.
- Turn off the heating mantle and lower it away from the distillation flask.
- 5.
- Slowly open the ballast valve to the lab ambient air. Let the pressure within the ballast increase to about 130 Torr, and then close the valve.
- 6.
- Raise the heating mantle back up to the sample flask and reenergize the mantle. Gradually increase the temperature, as before.
- 7.
- After boiling conditions appear to be relatively steady (that is the temperature and system pressure are about as constant as you can make it), almost simultaneously measure and record T and P.
- 8.
- Repeat steps 4 – 7 to get pressures near 160, 200, 250, 310, 380, 460,
550, 650 and 760 Torr.
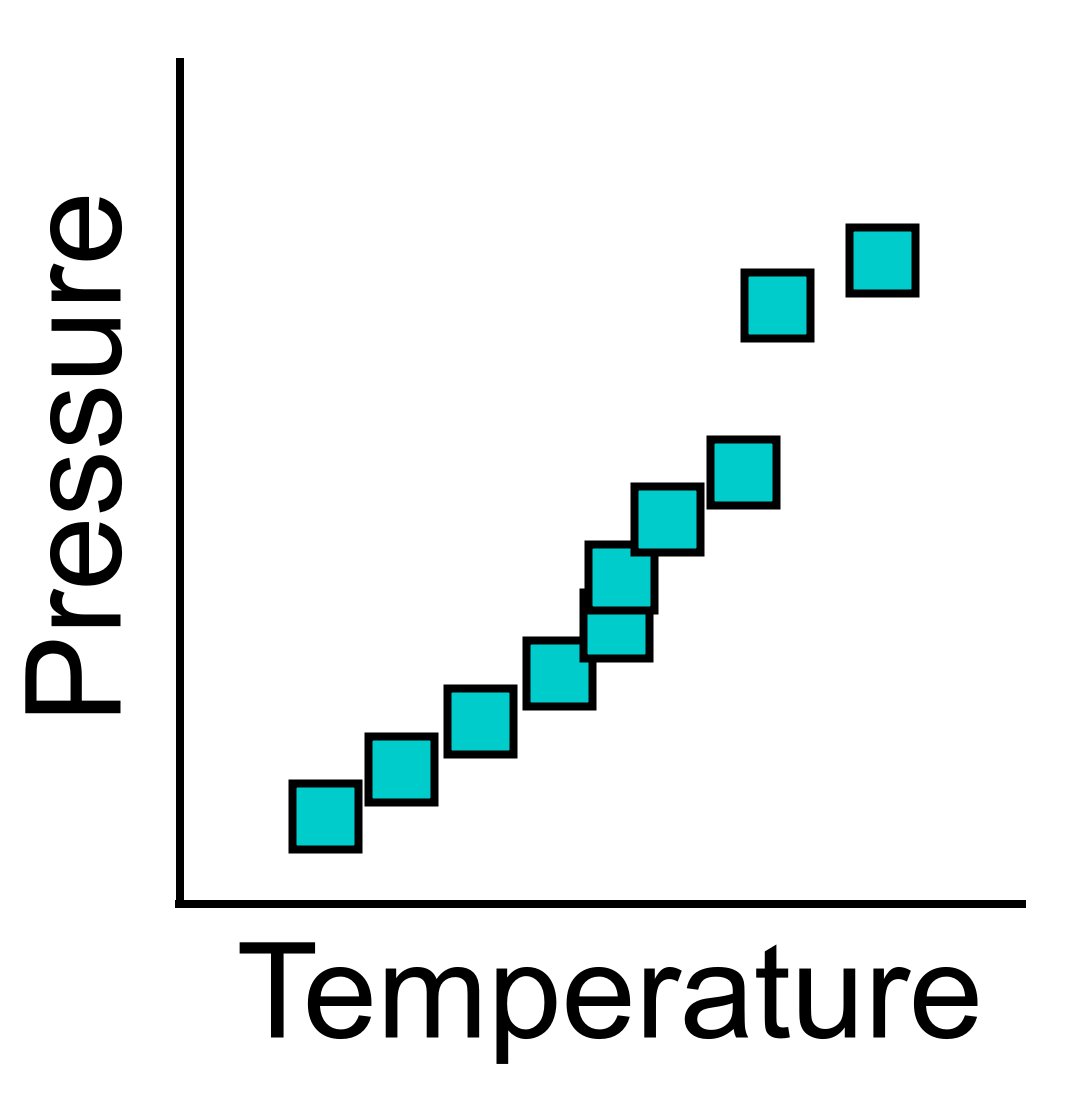 Figure 2: A sample set of datapoints acquired by students in the
PChem Lab.
Figure 2: A sample set of datapoints acquired by students in the
PChem Lab.
- 9.
- Repeat the above experiment with the second liquid. The apparatus will need to be first emptied, rinsed and dried. Ask your instructor about where to discard residual solvent.
- 10.
- Upon completion of the experiment, again empty, rinse and dry the apparatus, leaving it unassembled.
LAB ASSIGNMENT
Data Analysis
Perform the following analyses for both of your liquids. Print out and turn in the completed Mathematica notebook containing the following data analysis, fittings and requested values.
- 1.
- Create a table of your data in with boiling temperature in Celsius and pressure in torr.
- 2.
- Convert pressure to units of atm and temperature to Kelvin. Create a dataset of and .
- 3.
- Plot versus . Using non-weighted linear regression, determine the slope and intercept values of the best line fit through your data. Calculate the value for the fit. Show a plot of the data and the fitted line.
- 4.
- Using Equation (10), calculate the enthalpy (assuming that the compressibility factor ) and entropy of vaporization for your liquid.
- 5.
- Using these values, calculate the liquid’s normal boiling point, (at ).
- 6.
- Convert the error for the data points of and to and .
- 7.
- Convert those errors to the error on the and calculations.Note: you now need to properly propagate error!
- 8.
- Perform a weighted fitting of your data.
- 9.
- Using the results of the weighted fit, calculate the enthalpy and entropy.
- 10.
- Using the results of the weighted fit, calculate the liquid’s normal boiling point, (at ).
- 11.
- Plot data points, error on each point and fitted function together.
- 12.
- Compare your values of the weighted and non-weighted
fits (that is calculate the relative percent difference) with
literature values.One possible source may be found at
http://webbook.nist.gov/chemistry or through a cursory web search
- Comment on the values of enthalpy and entropy obtained by each fitting type (how they compare to each other and to the literature values).
- Compare the normal boiling points you obtained for each fitting (how they compare to each other and to the literature values).
- 13.
- It has been observed that the values of molar entropy of vaporization for most liquids are about the same. The constant value makes sense if there is no ordering among the molecules in the liquid state, so that the change of entropy is largely just the much larger entropy of the gas. This approximation breaks down if there is ordering in the liquid, as would occur with significant hydrogen bonding. According to Trouton’s Rule, the molar entropy of vaporization for non-associating liquids is typically . Compare this value to your value of the entropy of vaporization and to .
PEER REVIEW ACTIVITY
Everyone will write the Introduction Section and the References Section for the Peer Review activity. Keep the following in mind as you write your drafts of these sections.
The Introduction Section
The Introduction should include at least three paragraphs with at least one paragraph dedicated to the following three components of the Introduction section: the Phenomenon, the Model and the Technique.
The first paragraph should cover the Phenomenonwe use the term phenomenon as a way to get the writer to simply talk about what occurs, without trying to immediately apply a known model or system to what is being observed. For example, an object falling is a phenomenon we observe, and gravity is the model we use to describe it. In general, the first paragraph of the introduction should tell the reader why we care about the measurement and the values obtained. In specific for the HoV experiment, you might provide some context for why knowing enthalpies and entropies of vaporization and boiling points for organic liquids might be helpful in specific or certain applications. References are essential to providing the context in this section.
The second paragraph should introduce and explain the Model on which this experiment is founded. If applicable, this part should reference a theory or master equation that is being used (1) to drive why we are measuring that we are measuring and (2) to explain how we will use this equation to determine the values of interest. What would the equation of importance be for HoV? Identify this equation and introduce it in some way (do NOT re-derive it). Provide context for it. Identify and explain the assumptions involved with the equation. References are essential. This might be a good place to reference the lab manual or a text book for the background/derivation.
The third paragraph should introduce the Technique that will be employed. How will we exploit the system to make a measurement?the Clausius-Clapeyron equation does not tell us exactly which variables should be held constant and which should be varied during an experiment. You might consider an alternate version of this experiment where rather than varying the pressure and measuring temperature, we instead seal a fixed volume of liquid and vary the temperature while measuring the vapor presure of the liquid. We would arrive at the same results Do not exactly describe the experimental procedure (that is for the next Experimental section), but do explain the premise of the experiment you did. For example, you should (1) state the solvents used and (2) what is being controlled, what is being held constant and what is being measured.
The References Section
There are three types of references you might encounter: Literature references, Technical or technique-related references, and Results references. References should be taken from reputable, quality sources including the primary literature, textbooks and certain websites. The references may not consist entirely of websites.
There should be more than three references for each lab report. References should be directly cited in the text of the report (and in the proper format). For each laboratory report, you should reference the lab manual. Pay attention to the proper format of the references in the Reference Section and how they are cited in the written component of the laboratory report. See below for a reminder of what a reference section looks like.
REFERENCES
- 1.
- Halpern, A.M.; McBane, G.C. Experimental Physical Chemistry – A Laboratory Textbook, Third Edition, W. H. Freeman and Company, New York, 2006, pp. 11.1 – 11.6.
- 2.
- Garland, C.W., Nibler, J.W.; Shoemaker, D.P. Experiments in Physical Chemistry, Eighth Edition, McGraw-Hill Higher Education, New York, 2009, pp. 199-206.